How Looker helps startups uncover data-driven insights
In today’s data-driven world, business intelligence (BI) is essential for organizations of all sizes to make informed decisions, achieve their goals and stay ahead of competition. BI is an approach for transforming data into actionable insights that help make strategic business decisions. With the continuous evolution of technology, the landscape of BI practice has also undergone transformational changes. A decade ago, Looker redefined modern BI by introducing the idea of a semantic modeling model.
As a startup, you know that every decision you make is critical to your success. That’s why it’s important to have the right tools to help you make informed decisions. In this article, we will delve into Looker, a business intelligence and data analytics platform that can help you do just that.
Overview of the Looker product family
The Looker product family includes Looker, Looker Studio and Looker Studio Pro.
- Looker Studio is our user-friendly, no-cost visualization tool that lets you create dashboards directly from your raw data. It doesn’t require a centralized data model, and you can quickly import data from various sources. Additionally, it facilitates seamless collaboration, enabling easy dashboard sharing across different teams.
- Looker Studio Pro is the premium version of Looker Studio, tailored to the needs of business users. If offers several added advantages, including:
- Enhanced visibility of your data across your organization through an integration with Dataplex.
- An improved team collaboration experience with Team Workspaces, providing better access and content management functionalities
- Access to 24/7 support channels and a 99.9% availability SLA.
With Looker Studio Pro, you unlock access to more enterprise-focused features.
- Looker is our multi-cloud data platform that gives you data governance at scale by allowing data exploration on a semantic modeling layer.
The problem with traditional business intelligence tools
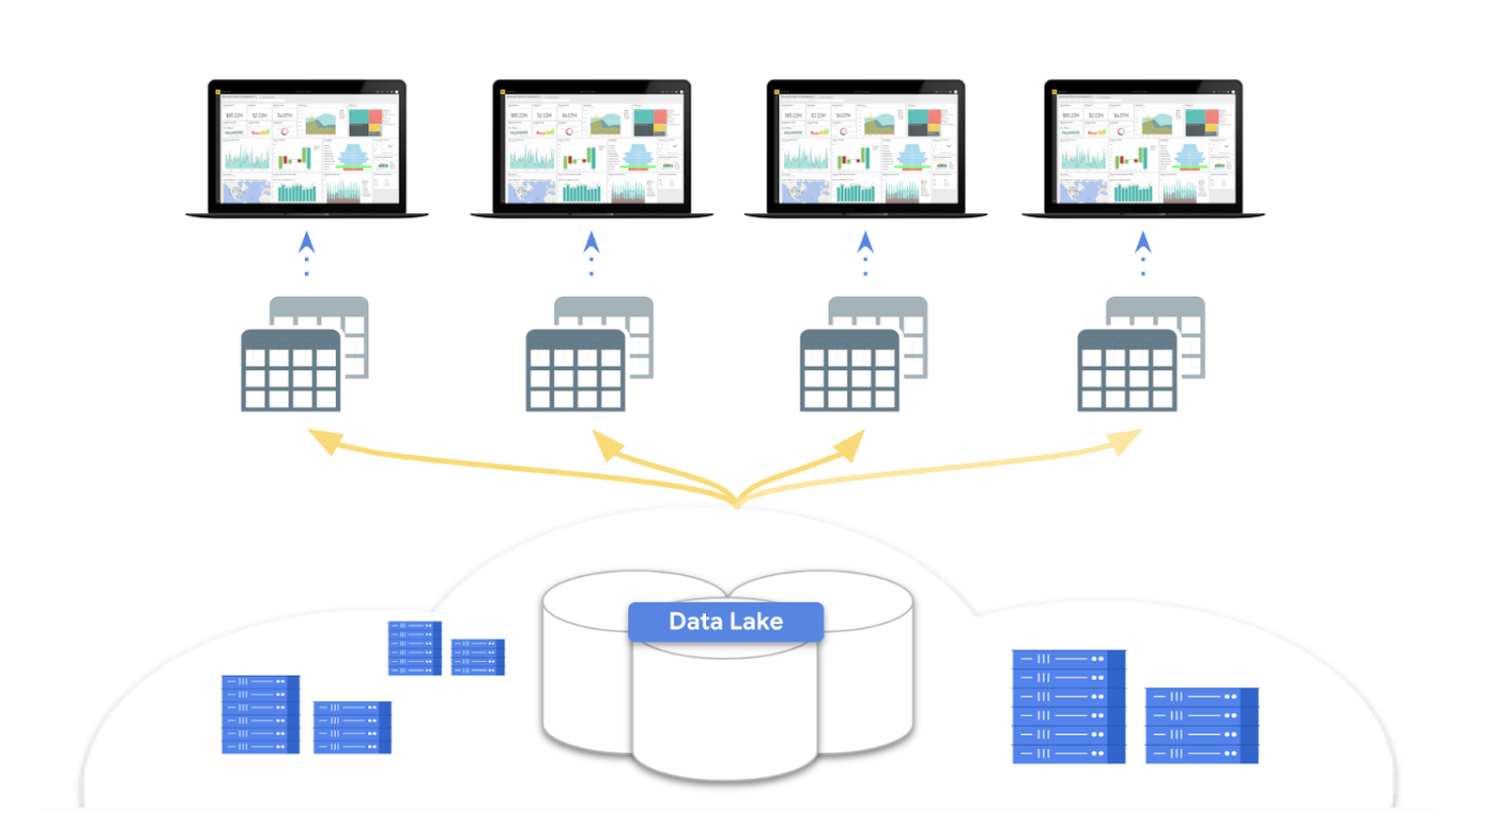
Traditional Business Intelligence tools require users to pull data from various sources within the organization to create customized dashboards for specific business goals. This can be complex as data lives in multiple repositories, requiring data analysts to use connectors or write complicated SQL queries for data extraction. Next, the data is aggregated into siloed workbooks, each representing different subsets of the overall dataset. Ultimately, this information is transformed into various dashboards and reports, tailored for consumption by business users.
This presents two challenges:
- First, it creates a bottleneck in the process. Whenever new information, like changes to metric definitions, needs to be incorporated, business users are required to engage the data team. This results in a time-consuming cycle of addressing numerous ad-hoc requests from multiple stakeholders.
- Second, it can lead to what some call “data chaos.” When the data team makes adjustments, whether adding, removing, or updating information, it’s done individually for each workbook and report. The lack of consistency in how business logic is defined undermines the reliability of our dashboards.
Looker effectively addresses these two challenges by providing a single source of truth for data. This eliminates the need for data analysts to be the bottleneck for data access, as everyone can access the required data directly from Looker. Furthermore, Looker offers standardized definitions of business metrics, eliminating the confusion that can arise when different people are using different definitions of the same metrics.
Under the hood
How to get real-time insights without moving your data
To understand Looker’s real-time data analysis, it’s essential to understand its interaction with your data. Business analysts often find business intelligence complex because they view ETL(Extract-Transform-Load) as a time-consuming and error-prone process. ETL is the process of moving data from one source to another, while transforming it into a format that can be used by the target system.
With Looker’s in-database architecture, business analysts can query the raw data right from the source, as opposed to the more time consuming data loading methods of traditional BI tools. This also enables dashboards to be real-time and reliable.
Looker supports over 50 SQL-compliant database dialects and continues to expand its coverage.
Looker’s semantic modeling layer: a single source of truth for BI metrics
Data teams within startups frequently face challenges stemming from data inconsistencies. This arises from the absence of shared definitions, conflicting business logics across different stakeholder teams and outdated data extracts. For example, when teams don’t align on metrics such as daily active users or pipeline growth, there is a poor data quality issue. This leads to inaccurate analysis and reporting, which can adversely affect decision-making.
Looker’s semantic modeling layer sits between raw data and the users, simplifying complex data for end users by provisioning a curated catalog, predefined business metrics and built-in transformation. Think of this as a dictionary of sorts, providing a common vocabulary for users to interact with. By bringing governed data directly to end users in tools they are already familiar with, this will democratize access to trusted data across organizations.
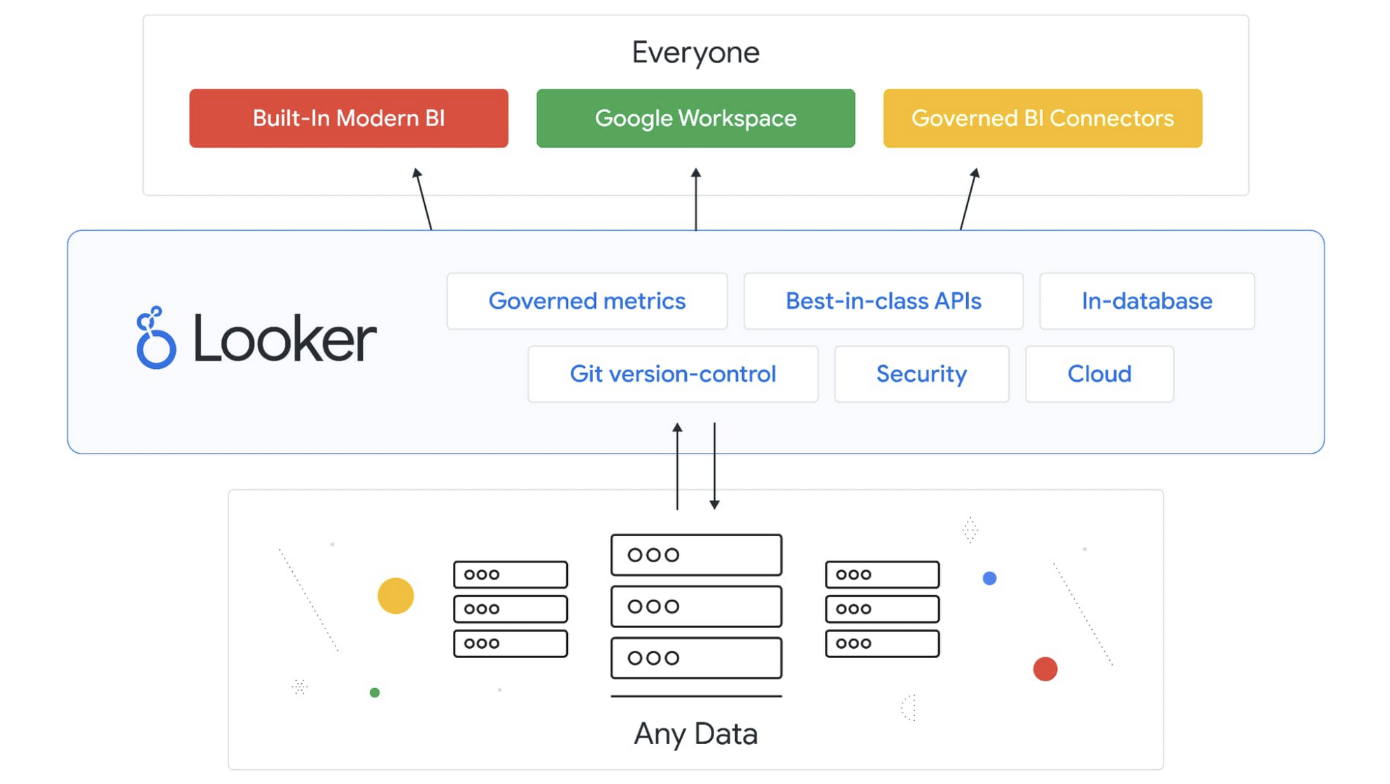
Improved analytics: Looker’s semantic layer enables standardized business metric definitions and real-time data access, promoting consistency across users, regardless of their location or role. Additionally, Looker’s built-in data transformation streamlines cleaning and enriching data, and improving data accuracy ,which ultimately enhances insights. This standardization eliminates the need for data scientists and analysts to spend time cleaning and preparing data which saves both time and money for startups.
Robust data security framework: Looker allows you to configure row level and column level security permissions, which helps in implementing an enterprise-wide governance framework. Row-level permissions restrict access to specific rows of data, while column-level security hides or masks fields based on user authorizations.
Better collaboration and ease of use: Various teams can collaborate on development using Looker’s Git IDE support for version control, bringing the best practices of software development into the data analytics field. Technical teams use LookML (Looker Modelling Language) to create data models and define business metrics, while business users can create dashboards without having to write complex SQL queries.
Overall, a semantic modeling layer can provide a number of benefits for companies that are looking to improve the quality, consistency, governance, and security of their data.
Looker Explores and Dashboards: Painting a picture with data
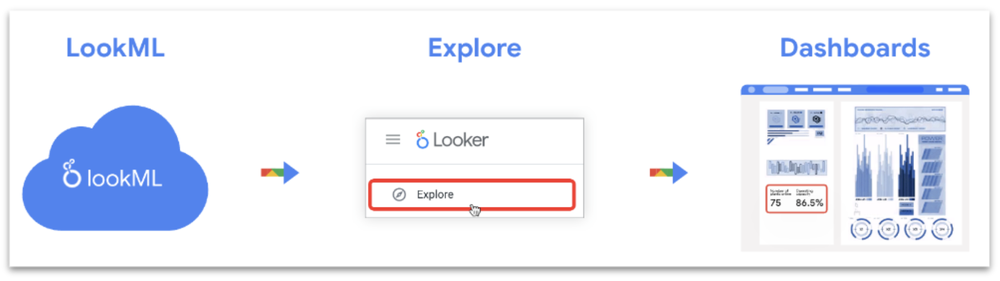
Looker is a powerful business intelligence tool that allows you to create interactive visualizations of your data through an easy-to-use drag-and-drop interface. You can use Looker’s visualization layer which includes multiple visualization options to explore your data, identify trends, and share insights with others.
With Looker’s Visualization Layer, you can build custom dashboards, reports and Looks, effectively organizing and presenting your data in a logical, cohesive and meaningful manner.
Looks are single visualizations/tables made by business users. Any changes made to a Look will be reflected in any dashboards that contain it. This means startups can now quickly adapt to changing market conditions by easily updating their data models and dashboards.
Dashboards combine multiple charts, tables, and Looks into one page to collate relevant data and KPIs. Users customize them to show the most relevant insights. These dashboards can be created using the Looker UI or LookML. You can also embed these dashboards into your applications, expediting enhanced data analytics for customers and internal teams. Looker enables startups to consolidate their data and gain a comprehensive view of their business making it easier to make data-driven decisions.
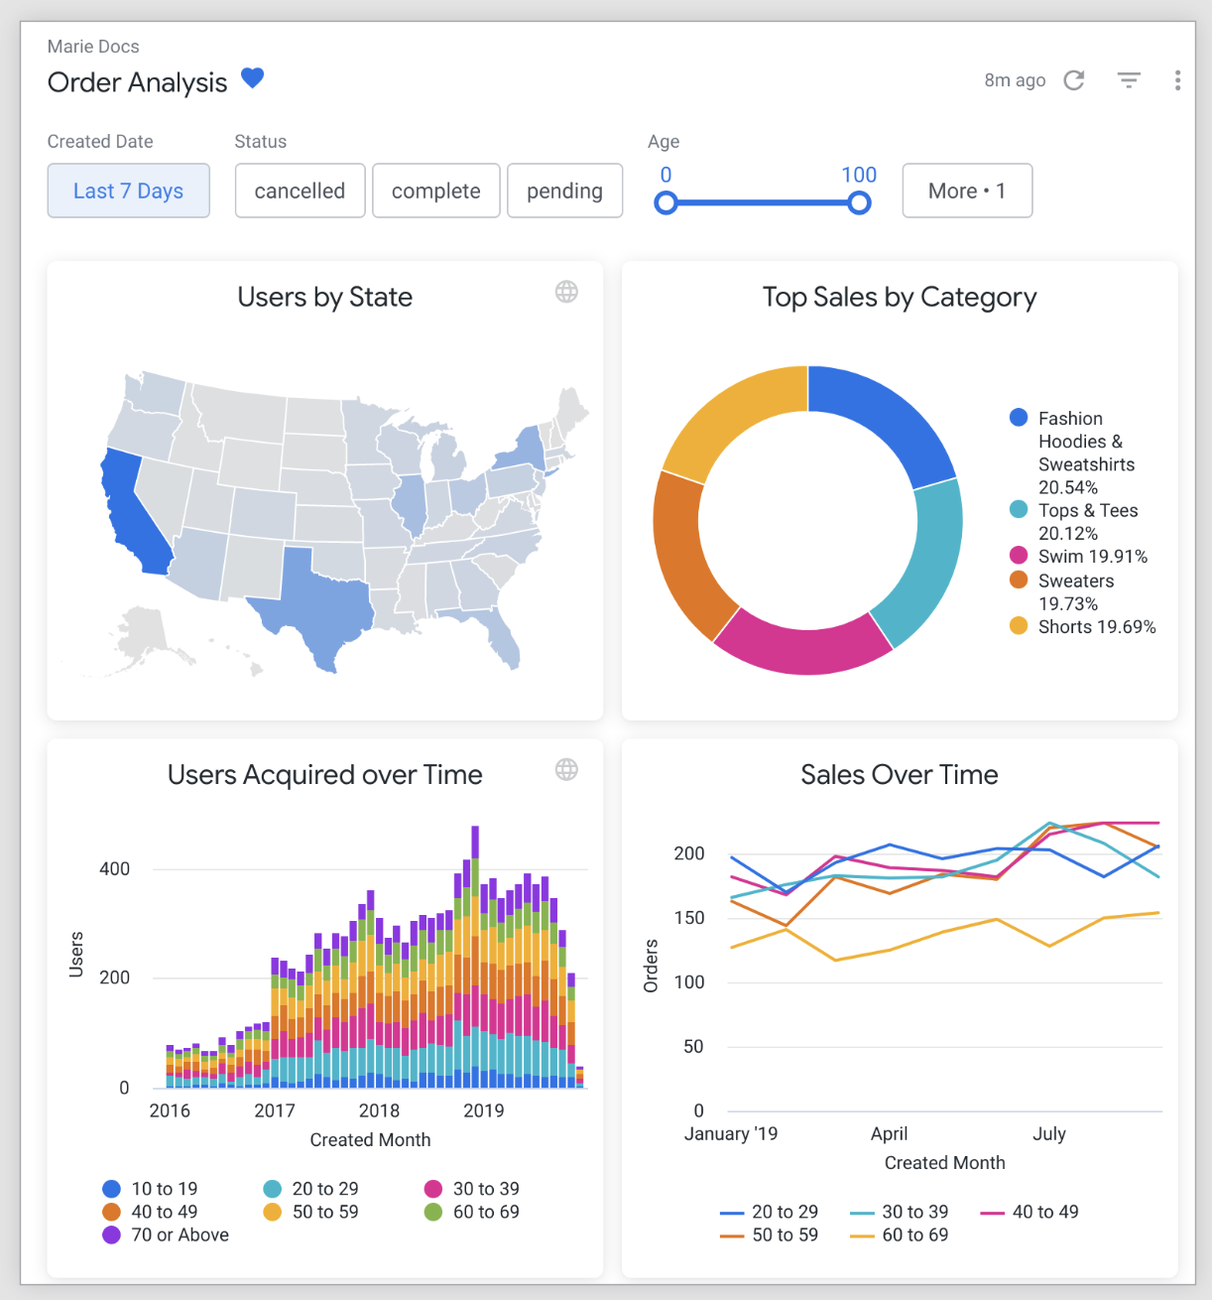
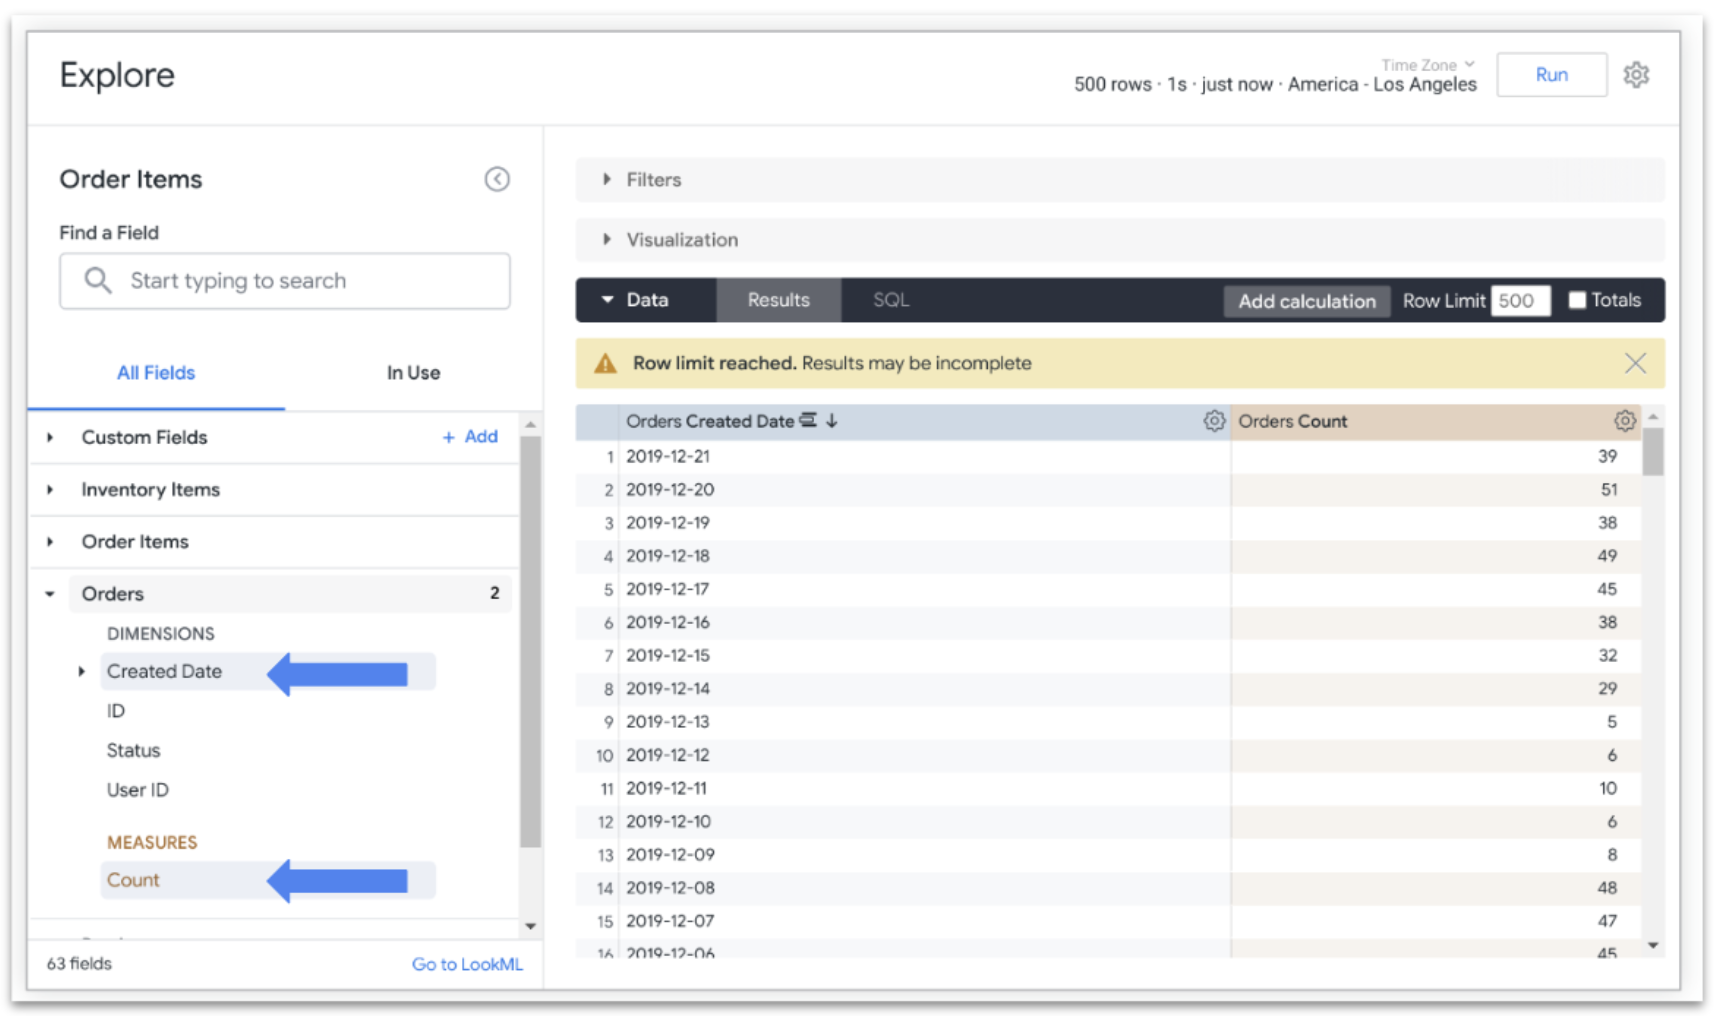
Looker’s Explore feature empowers detailed data exploration. Users can apply filters, create calculated fields, and aggregate data on-the-fly, ensuring rapid and code-free access to the insights they need.
For example, to display the number of orders that are placed per day, a user can select the dimension Created Date and the measure Count from the Orders view in the Order Items Explore.
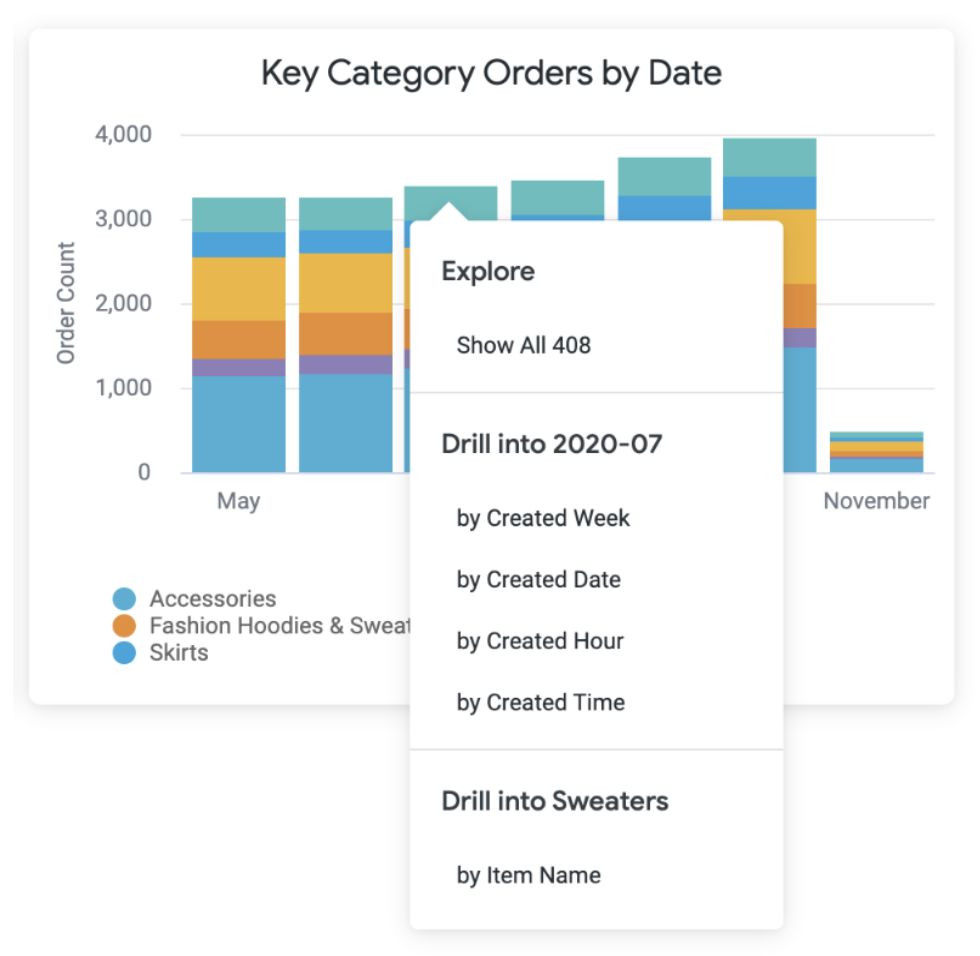
As Looker connects directly to your data, you can drill down to the most granular level. Let’s take another example, to delve into sweater orders in July, simply click on the sweaters bar in the July stack to access the drill menu.
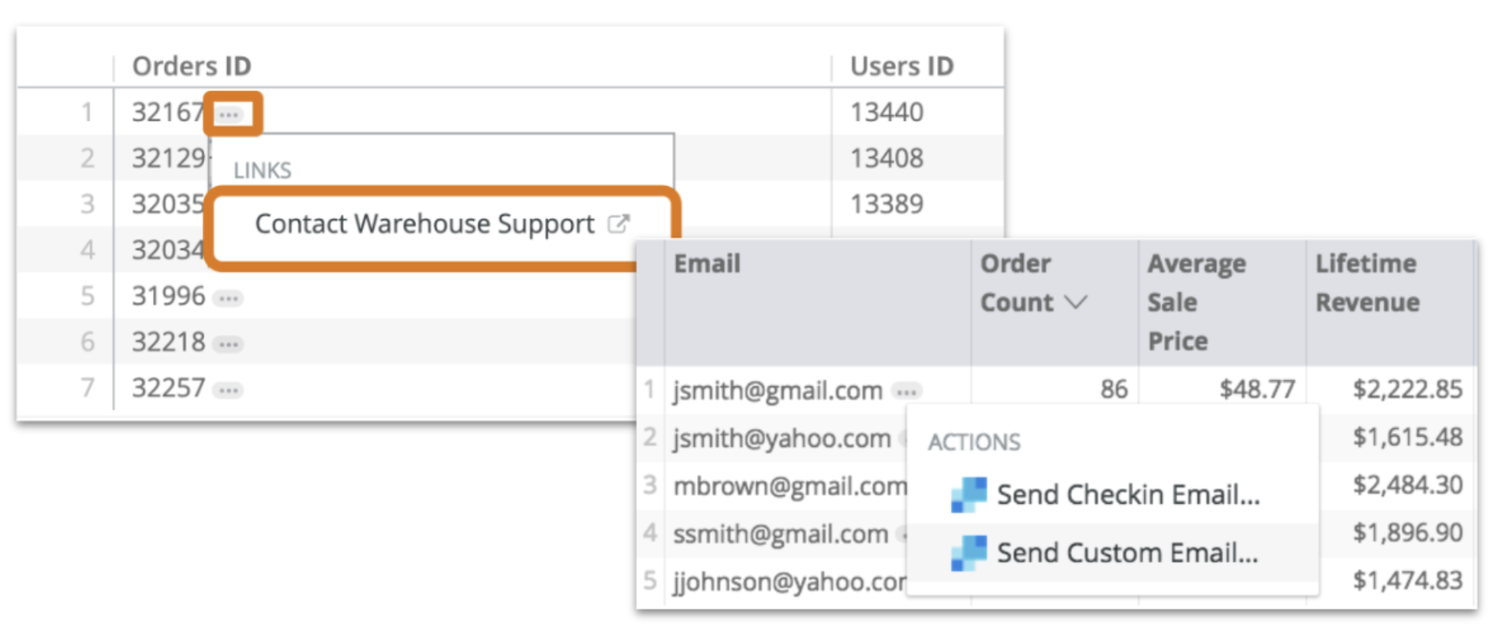
You can also add hyperlinks and actions in Dashboards. The link parameter lets you add web links to dimensions and measures, enabling users to navigate to related content directly from Looker. Actions allow users to perform tasks at the click of a button while browsing dashboards and visualizations. For example, the action can send an email or perform any other configurable actions on a receiving server.
Looker is a cloud-native, fully browser-based BI tool with an API-first approach allowing users to analyze data and automate workflows based on data. Have a look at Google youtube video — Uncovering insights with Looker to see how you can go from data to insights using Looker!