ArcGIS and BigQuery – a match made for geodata
Geographical data is one of the critical datasets for data-driven organizations to make informed business decisions. As the data is growing more than ever before, it’s becoming more challenging to manage and analyze mammoth datasets using traditional databases, this is true for geographical data as well as it requires significant computational power to process.
Esri has been one of the leading companies in Geospatial software development since 1969. Esri ArcGIS is one of the most powerful and widely adopted location intelligence, geo-mapping, and spatial analytics products.
With the latest release of ArcGIS Pro and ArcGIS Enterprise, Esri customers can now leverage the power of BigQuery to run geospatial analytics. There are a few reasons why you might want to run BigQuery and ArcGIS together.
- Perhaps you have been running into performance issues in GIS applications to explore, analyze and visualize geodata due to the growth of the data
- You have been looking for a cost-effective big data processing engine for your geodata to increase the map interaction on ArcGIS
- Perhaps you want to enable your users with real-time insights on streaming data
- You have been thinking about using machine learning to do more with your geospatial data inside ArcGIS
BigQuery’s built-in machine learning, streaming insert, and ability to store and process large geospatial datasets at scale make it an excellent companion to ArcGIS for these use cases and more.
BigQuery has first-class support for geospatial data processing
BigQuery is the leading solution for analytics enabling tens of thousands of customers to run analytics at scale. BigQuery customers analyzed more than 275 exabytes (EB) of data in December 2021, an increase of 350% YoY with hundreds of customers using petabyte scale environments, all with 99.99% SLA. BigQuery also provides a geography data type and standard SQL geography functions to analyze geospatial data. BigQuery’s streaming insert capabilities help you get real-time insights on streaming geospatial data.
BigQuery’s built-in machine learning
BigQuery Machine Learning, popularly known as BQML democratizes machine learning by letting you create machine learning models using standard SQL functions without moving your data out of BigQuery. This opens the possibilities of unearthing the potential of your GIS data using the latest machine learning models with just standard SQL.
In this post, Google will show you the examples of using both of these capabilities in conjunction with ArcGIS advanced functions and visualizations.
ArcGIS integration with BigQuery
With the recent release of ArcGIS Pro 2.9 and ArcGIS Enterprise 10.9.1, ArcGIS users can now establish a live connection with BigQuery to explore, visualize, analyze and share geospatial data within your organization. The following is a quick overview of steps on how to establish such a connection from ArcGIS pro. The demo assumes that you have ArcGIS Pro (Windows) already installed:
1. To be able to connect to BigQuery datasets from ArcGIS Pro, you need to have a GCP project, and enable the BigQuery API using the GCP console. (Click here to set up a free project using the BigQuery Sandbox)
In this article, Google will be using noaa_lightning and london_bicycle BigQuery public datasets. BigQuery hosts these public datasets for you, and you can explore, analyze and visualize these datasets using other applications such as ArcGIS Pro. Because these are public datasets, Google hosts them for free, and you pay only for the queries that you perform on the data. The first 1 TB per month is free, and you can access these BigQuery public datasets using Cloud Console or discover which ones you need using the Public Data Catalog.

2. We will use lightning strike public dataset authored by NOAA. The sample schema for the table can be found here.
Create a new dataset arcgis_bq and a view lightning_all to union lightning strike information for years 1987 to 2020 by running below script inside BigQuery console.
DECLARE query STRING;SET query = (SELECT STRING_AGG(CONCAT('SELECT * from bigquery-public-data.noaa_lightning.lightning_', year), ' UNION ALL \n')FROM UNNEST(GENERATE_ARRAY(1987, 2020)) year);CREATE SCHEMA IF NOT EXISTS arcgis_bq;EXECUTE IMMEDIATE('CREATE OR REPLACE VIEW arcgis_bq.lightning_all AS SELECT * FROM (' || query || ')');
Script to create a new dataset and a view to union lightning strike data for 1987 to 2020 as each year has its own table in public dataset, paste and run this in BQ console
3. We assume that you have ArcGIS Pro already installed on a Windows machine. ArcGIS uses the ODBC connection to communicate with BigQuery. Download and install BigQuery odbc driver on the same Windows machine.
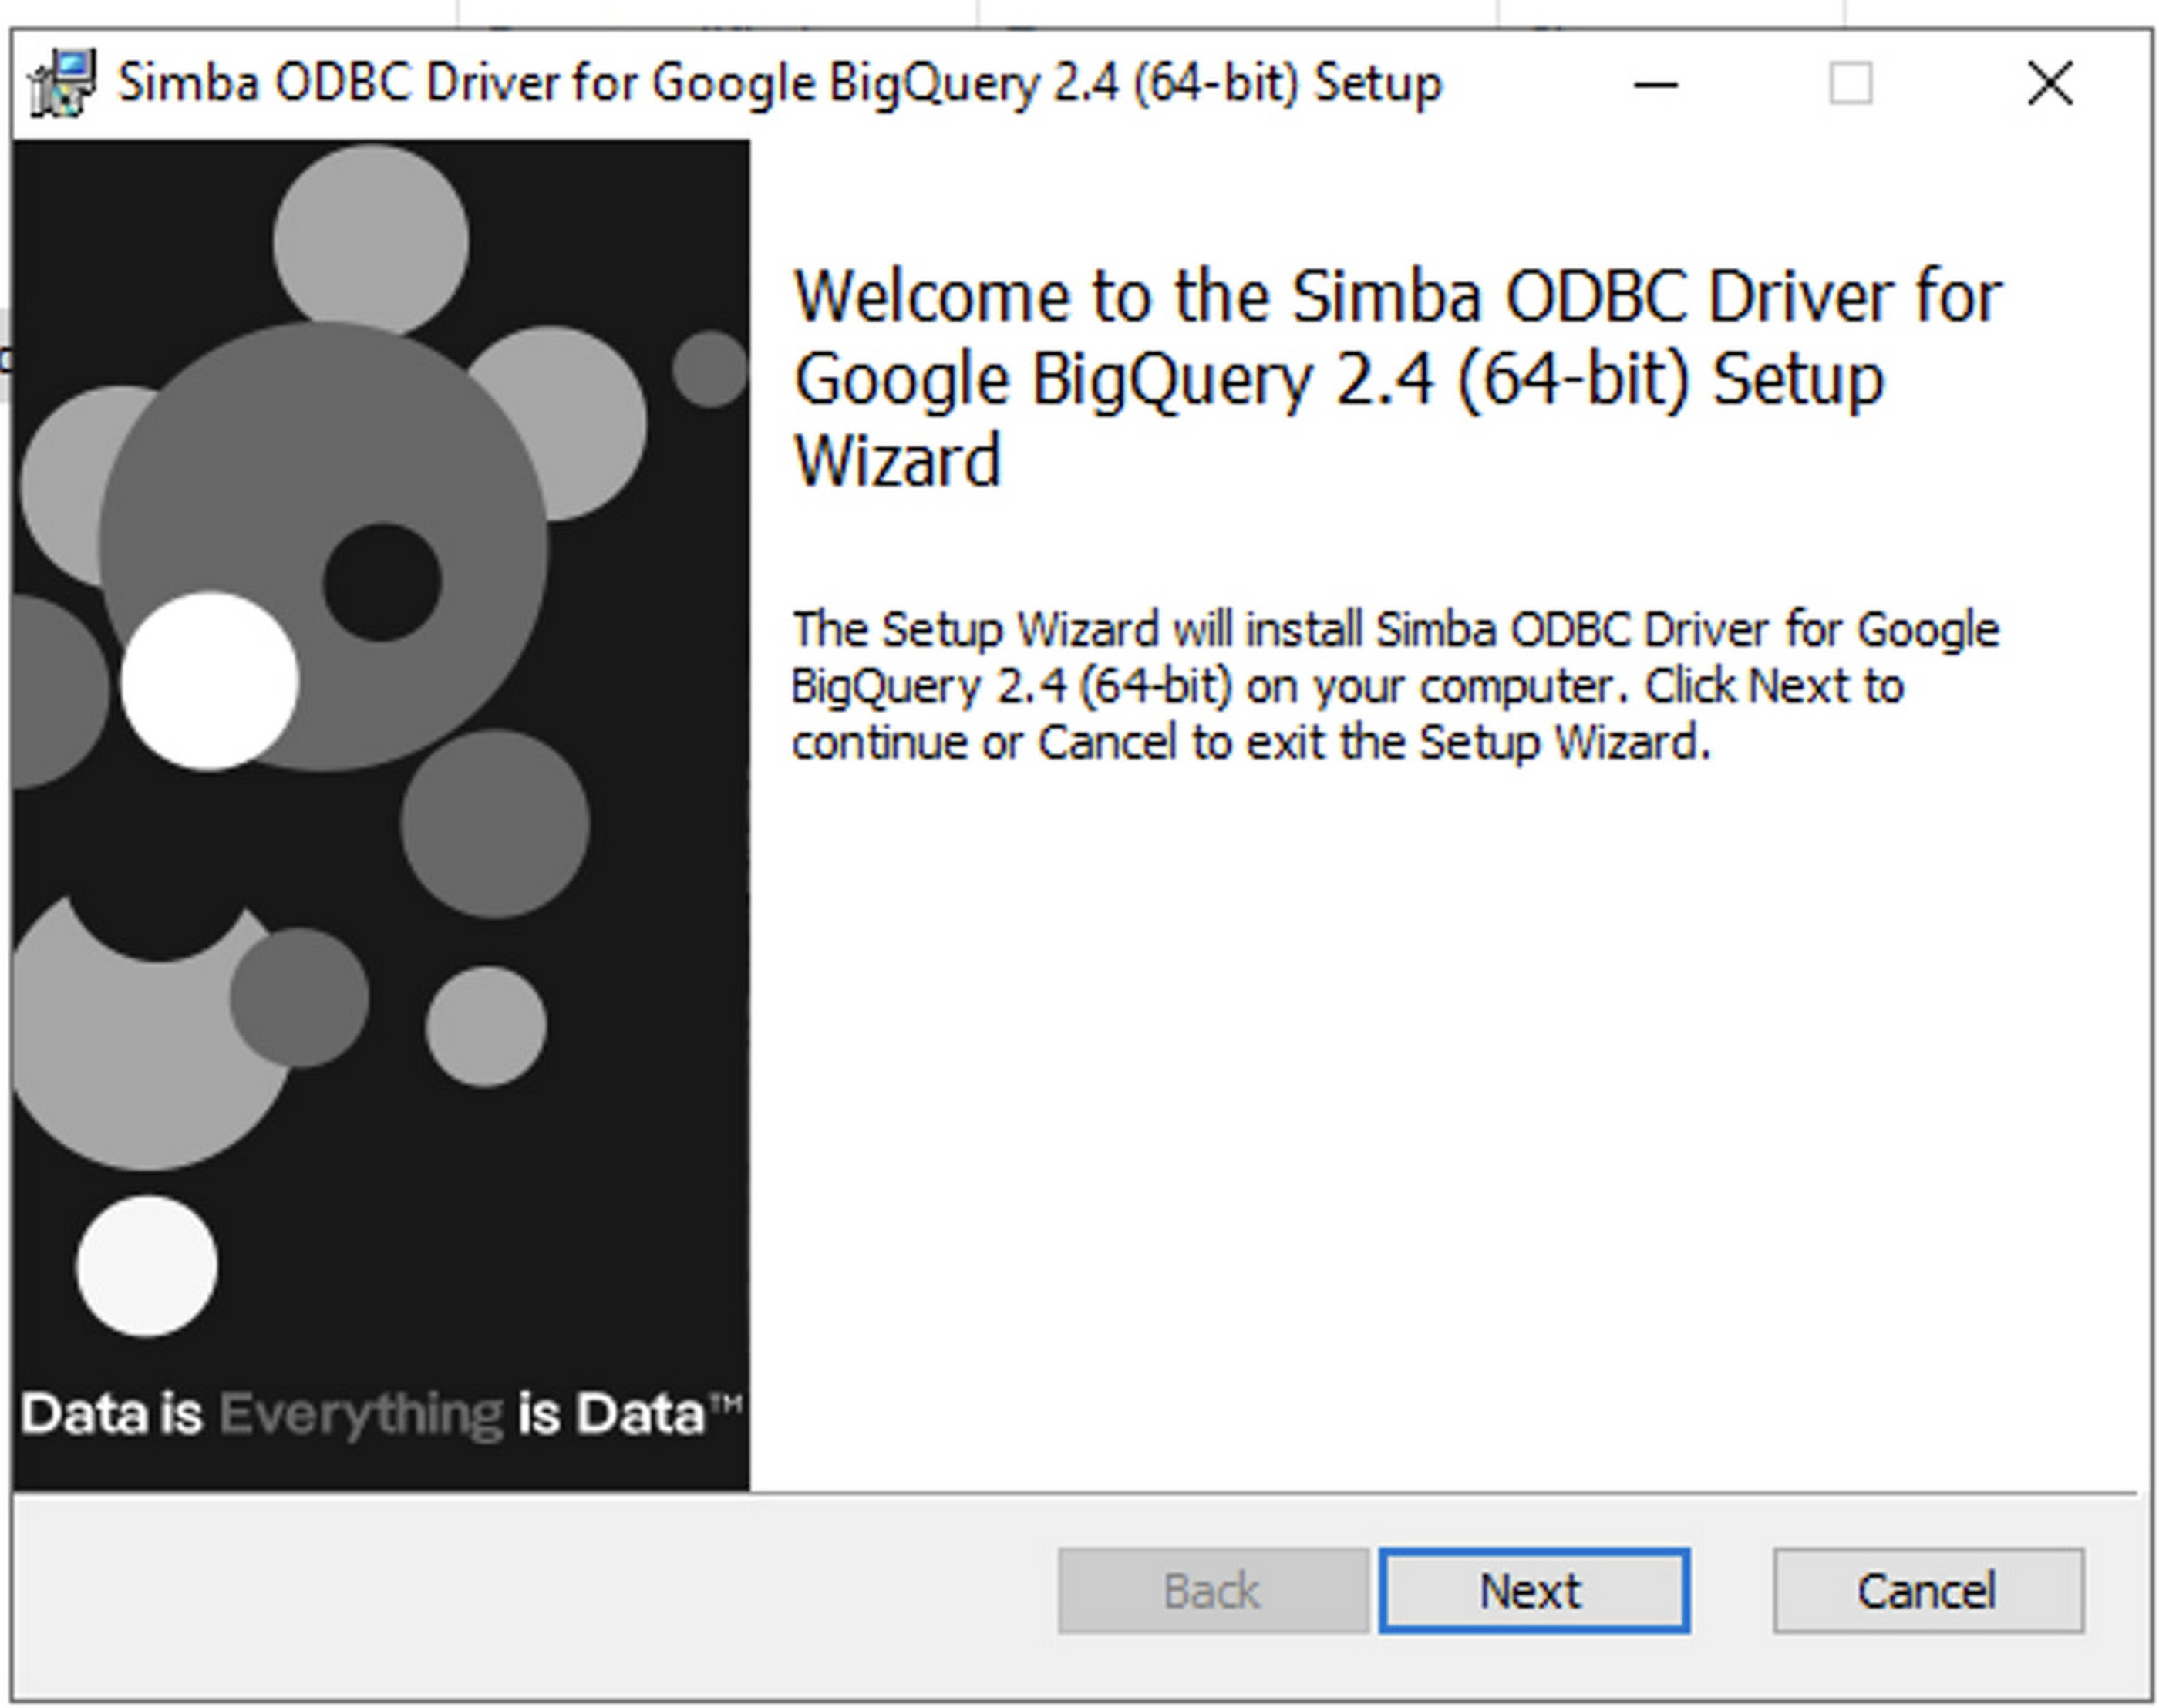
4. With the ODBC driver installed, open ArcGIS Pro and in the Insert tab from ArcGIS Pro, create a new database connection

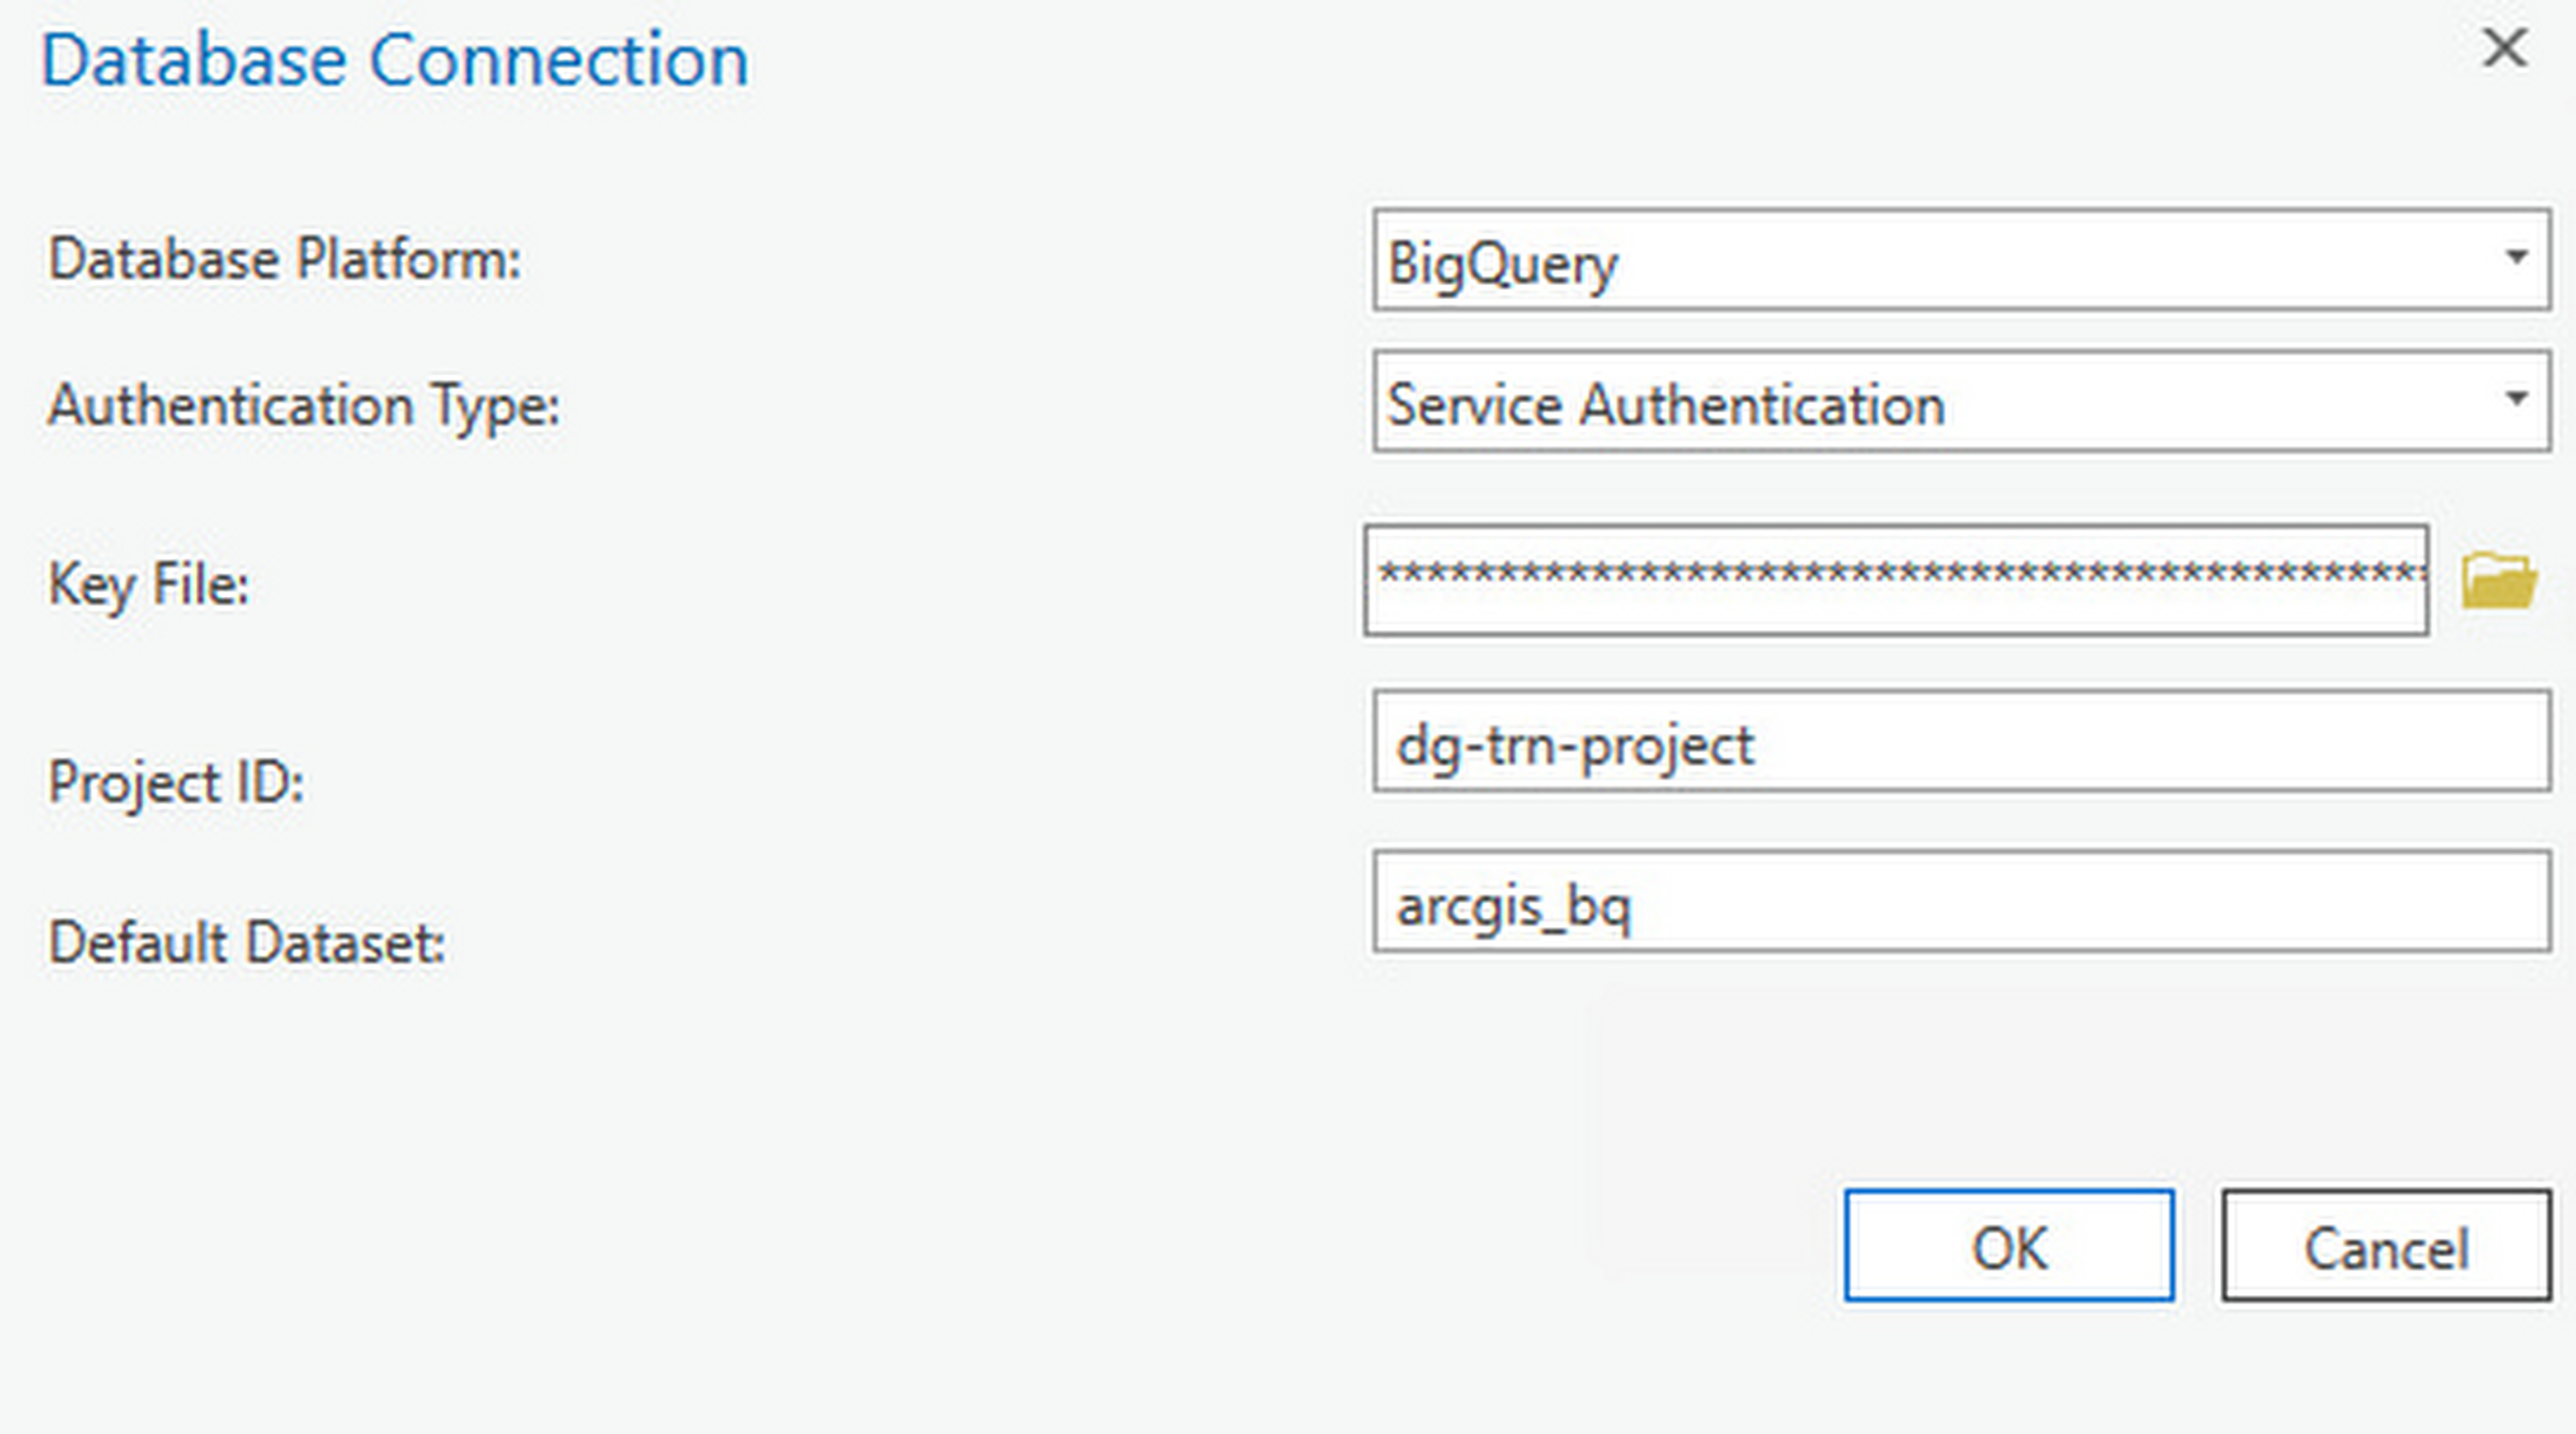
Fill in the information in the database connection dialog,
- Database Platform, choose BigQuery from dropdown
- Authentication type, you may choose user or service authentication, you would need to setup service account with appropriate permissions and download credentials
- For Keyfile, browse to the downloaded credential file and click on Open
- Project ID: specify a GCP project-id for which the service account has access
- Default Dataset: enter a BigQuery dataset name that can be accessed using the service account
Special Note on Service Account Permissions
BigQuery public data is open to the public, however, for accessing data that is stored in a customer managed BigQuery datasets, the following permissions are required on the service account. This will provide access to all BigQuery datasets in any project accessible via the service account:
- bigquery.jobs.create
- bigquery.readsessions.create
- bigquery.readsessions.getData
- bigquery.routines.get
- bigquery.routines.list
- resourcemanager.projects.get
- bigquery.datasets.get
- bigquery.tables.create
- bigquery.tables.delete
- bigquery.tables.get
- bigquery.tables.getData
- bigquery.tables.list
- bigquery.tables.update
- Bigquery.tables.updateData
In some situations you may need to work with your organization’s policy administrator to create a custom role that can be assigned to the service account. 5. Create a query layer in ArcGIS Pro:
We would like to understand the lightning strike spatial distribution across the United States. In this example, we will be adding multiple query layers from BigQuery public datasets and the view we created earlier in step 2.Open ArcGIS Pro, from ToolBar choose “+Add Data”, and select “Query Layer”
Add the below query in the dialog which will aggregate over over 90 million rows of data.
SELECT sum(number_of_strikes) as totalstrikes, inputb.state_name, inputb.area_land_meters as state_area, any_value(inputb.state_geom) as state_geomFROMarcgis_bq.lightning_all as inputa, bigquery-public-data.geo_us_boundaries.states as inputbWHERE ST_WITHIN (inputa.center_point_geom, inputb.state_geom) = trueGROUP BY inputb.state_name, state_area
Query to get number of lightning strikes by state, here, we also use the view we created in step 2
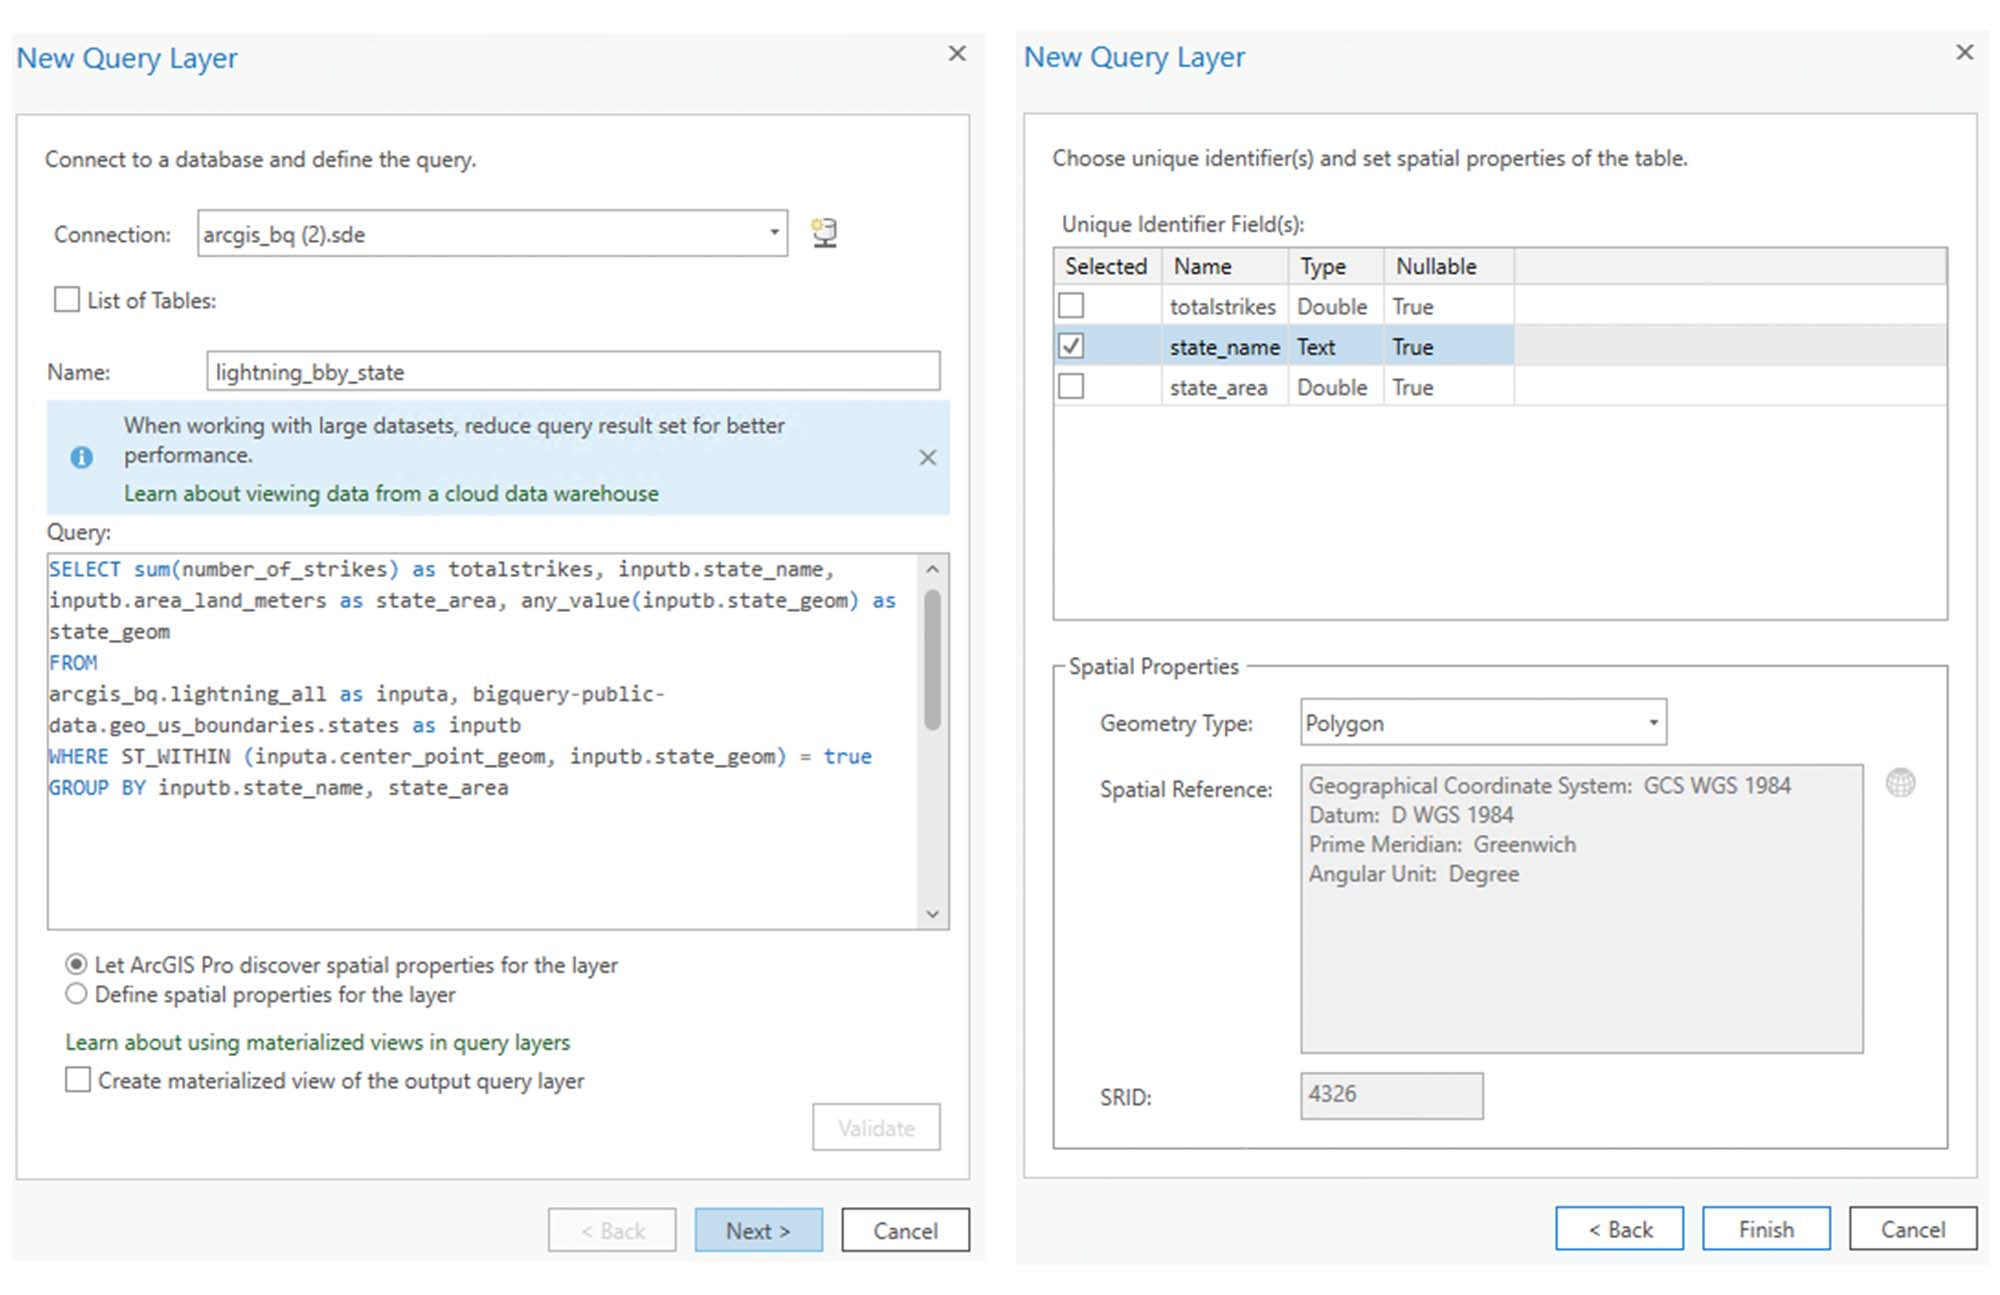
You can enable materialized views for the query layer to increase the performance of your map interaction, it is also suitable for the aggregation on large datasets or streaming data. You also have the option to set the materialized view to expire. This is required in order to avoid additional charges for the view, especially if it is only needed for a short period of time.

The query executes a BigQuery ‘point in polygon’ geospatial analysis function (ST_Within) via an ArcGIS Query layer. The query performs a ‘point in polygon’ analysis of ~50 states against 90 million lightning strike locations across the United States. By taking this approach we leverage the analytical processing power of BigQuery directly from ArcGIS Pro.
You can also adjust the map symbology, applying ‘graduated colors’ and normalize by state area to better view the lightning strike data. The results are interesting, our initial hypothesis was that Florida would have had the highest number of lightning strikes. However, from the resulting map, Texas also has a significant number of lightning strikes.
Query against the County dataset
The analysis at the state level gives us a high level understanding of lightning strike distribution across the United states. However, analysis at the county level could tell a different story. We want to quickly look at the top 20 counties for lightning strikes across the United States.
Create a new query layer called ‘county_lightning_summary’ using the below query. This will perform a similar ‘point in polygon’ (ST_Within) analysis of lightning strikes compared to county boundaries. It will also union all the years for lightning strike data on the fly as a part of the view we created earlier. We will use the bigquery-public-data.geo_us_boundaries.counties layer for analysis. We will also return the counties as points as opposed to polygons.
with hs as (SELECT inputb.geo_id, sum(number_of_strikes) as totalstrikesFROM arcgis_bq.lightning_all as inputa, bigquery-public-data.geo_us_boundaries.counties as inputbWHERE ST_WITHIN (inputa.center_point_geom, inputb.county_geom) = trueGROUP BY inputb.geo_id)SELECT county_name, int_point_geom, totalstrikesFROM bigquery-public-data.geo_us_boundaries.counties aJOIN hsON a.geo_id = hs.geo_idORDER BY totalstrikes DESCLIMIT 20
Query to select top 20 counties for lightning strikes in years from 1987 to 2020
The query performs a point in polygon analysis of ~3200 counties against 90 million lightning strike locations. From the newly created map we can see that several of the counties with the highest lightning strike totals are found outside of Texas. Eight of the twenty counties also belong to Arizona.

ArcGIS Pro and BigQuery Visualization Performance Tips:
For large spatial tables (geography column is present) that are stored in your local BigQuery data warehouse and need to be visualized in ArcGIS Pro:
- Access data via Esri query layers where possible. This is especially true for large datasets.
- Enable materialized views to improve performance and apply expiration dates as needed to save costs. The materialized view is deleted upon expiration.
- Apply Esri feature binning for visualizing very large point datasets (millions of points). This has additional display performance benefits.
Machine Learning on Geospatial Data
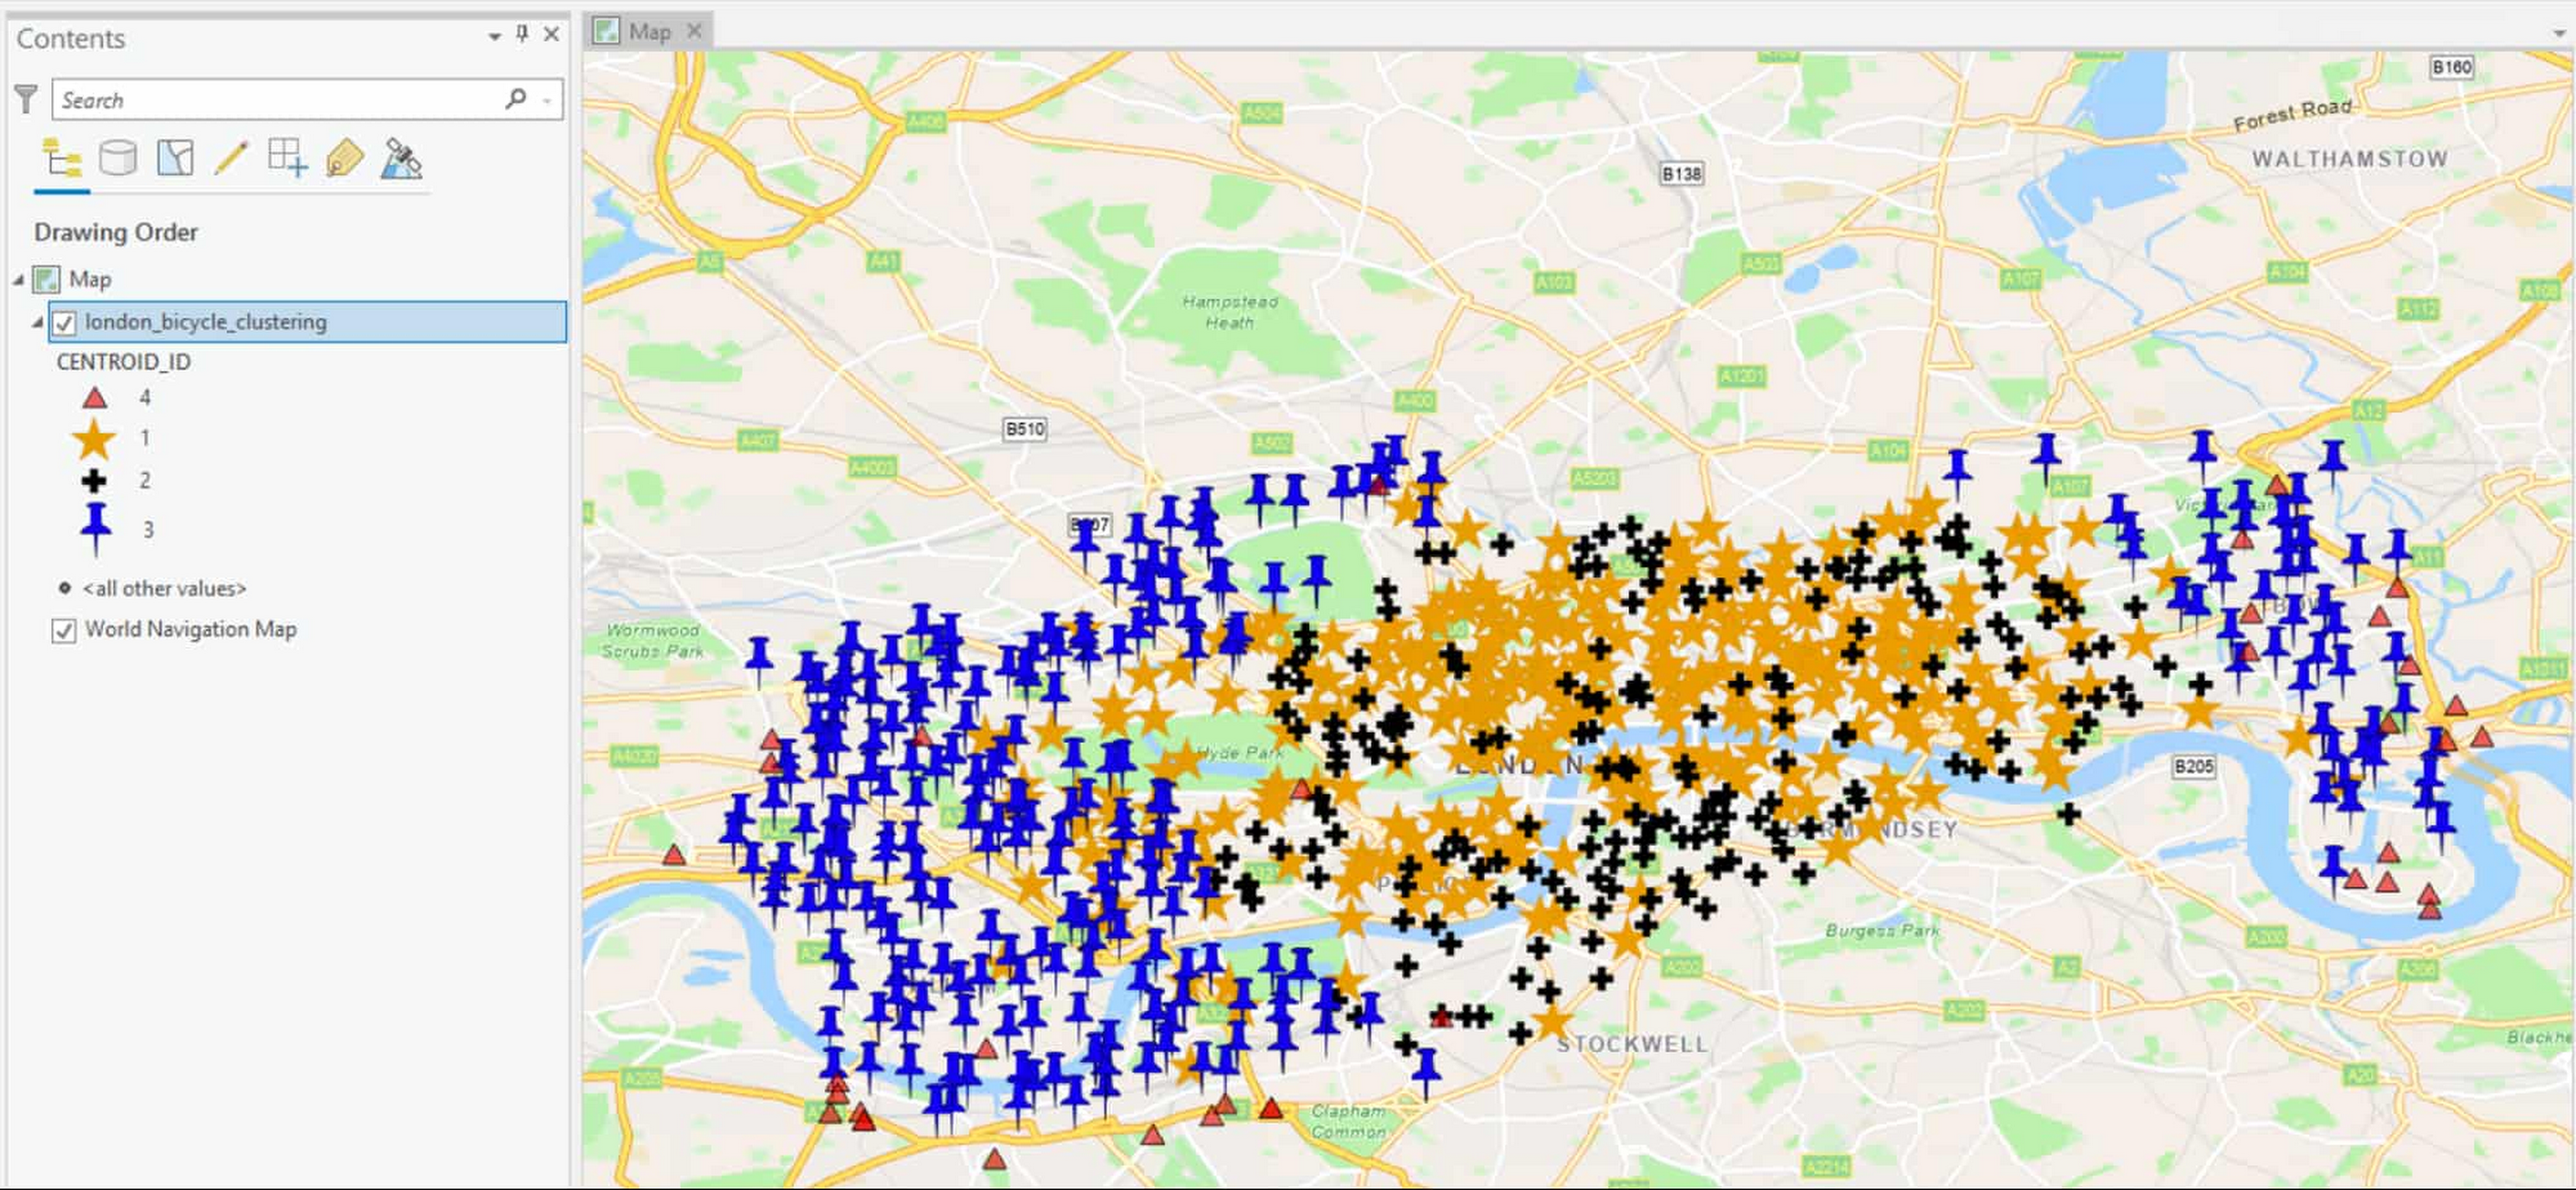
You can also use BigQuery Machine Learning to do deeper analysis on your geodata and use ArcGIS to explore the results of your ML models. As explained in this example which uses London bicycles data, we used the k-means model in BigQuery ML to build clusters of cycle hire data. The following image shows the summary cluster model of bike stations, calculated from the city center.

Cluster #1 shows busy station closer to the city center, cluster #4 shows stations with longer duration trips, and away from the city center. We can easily show bike stations’ cluster spatial distribution in ArcGIS map.
You can also use our previous example of lightning strike, and train a model using BigQuery Machine Learning to predict the number of lightning strikes by state or county for 2021 and 2022.
Conclusion:
Esri customers can now unlock the potential of geospatial data using cloud-native data warehouse BigQuery. As analysis of geospatial data is a compute-intensive task for larger datasets, BigQuery’s serverless and petabyte-scale nature makes it the perfect fit for this kind of workload. It also reduces maintenance overhead, so you can focus more on insights and analysis using ArcGIS. You can easily load geospatial data into BigQuery using load jobs, geobeam or FME. You can also stream data into BigQuery with the new Storage Write API to get real-time insights on streaming data. You may create materialized views within ArcGIS output query layer for aggregation on large datasets or streaming data, it also increases the performance on map interactions.
BigQuery supports geography data type and several SQL standard geography functions to do geospatial analysis, users can also use BQML for predictive or descriptive analytics on geo data and then connect to ArcGIS for further analysis.
You can quickly get started by connecting ArcGIS to BigQuery, you may load your own data into BigQuery or leverage one of the BigQuery public datasets to run your initial tests. In addition to BigQuery integration with ArcGIS, with the recent release of ArcGIS Enterprise, you can also deploy ArcGIS enterprise on Google Kubernetes Engine(GKE).
Stay tuned for more content on ArcGIS and Google Cloud. In the meantime, please reach out to your account team or you can also contact Cloud Ace’s sales team to know more about new features around Esri ArcGIS and Google Cloud.